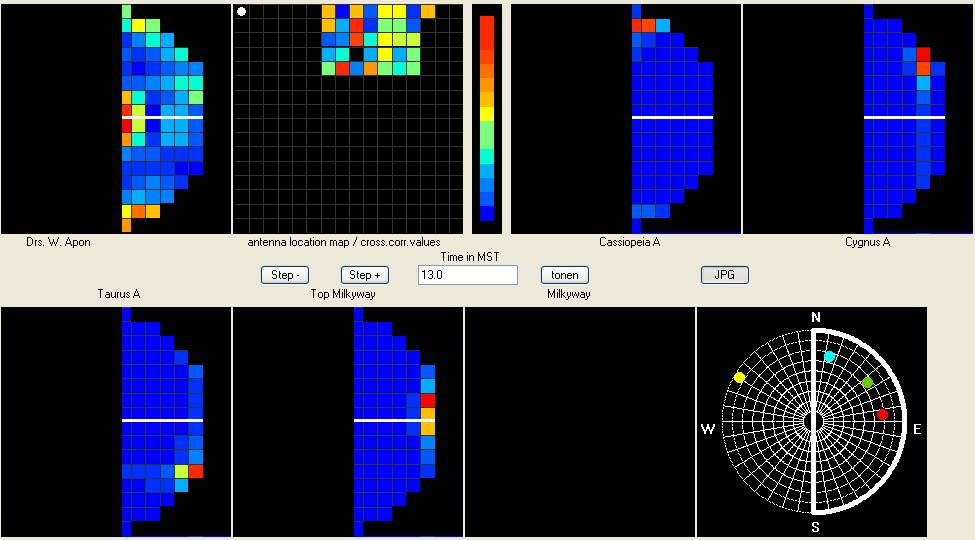
You see 9 graphs.
The one Upper Left is my interferometry map of the sky at 13:00 hours MST.
In top is the North. The East is at the right side.
The bottom is the South. The middel left is the zenith.
Because the western half is symmetric i omitted that.
The second graph shows the used antenna positions whith the values of the crosscorrelation at
that position in color. ( values are relative)
Every quadrangle is 4 by 4 meter.
The white dot is the position of the fixed antenna.
Next to this graph is the color scale. Red is maximum and blue is
minimum.
The next 5 graphs are simulated maps of the brightest sources, calculated in the same way
as my measured map.
I used all 16 by 16 antenna positions for it.
The last graph at the right bottom is the location of the brightest sources on a normal star-map.
Blue is cassiopeiaA, Green is CygnusA, Yellow is TaurusA and Red is The Milkyway.
As a geologist i am used to put the east at the right side... ( sorry astronomers)
On my map You clearly can see CassiopeiaA , CygnusA and the top of the Milkyway.
In the zenith you see the DC-value of the 2D-FFT.
What is in the south: I don't know....
It looks that you can make a map of the radiosky with simple apparatus....
Two antenna's, to front-end amplifiers, 2 coherent receivers, a computer soundcard and
some ( a lot ) home made software.
Do realise that it took 36 days of measuring, getting about 36 * 6 GByte = 216 GByte of data!
With all this data i can make 1440 maps of the sky. One for every minute.
So still some work to do.
29-5-2011
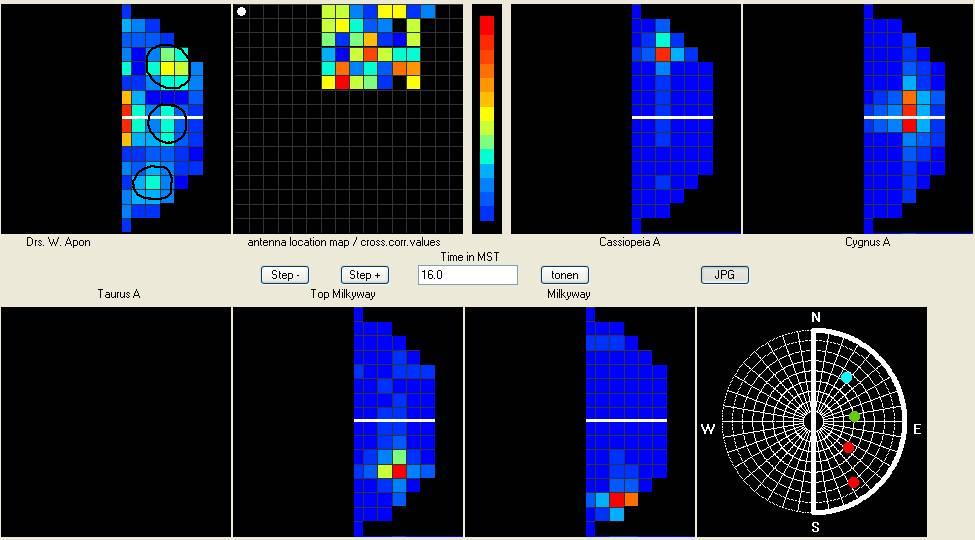
An other splended result, now of 16:00 MST.
Now i am sure my methode works!
Below you see in the three circles:
Upper is CassiopeiaA
Middle is CygnusA
Lower is Top Milkyway